ROSDASH Docs
Introduction
Usage
Examples
Widget Development
Dependencies
License
Authors
Acknowledgement
Todo List
Introduction
Welcome, roboticists and ROS users!
Here is a demostration and debug platform for ROS, which is easy to use and simple to extend.
- Simply open your browser to visualize your robots
- Connect with ROS and communicate with your robots
- Multiple widgets to choose, i.e. plotting tools, Google maps, 3D visualization, etc
- Drag and drop to create a dashboard
- Develop the dashboard with fancy Javascript and HTML5
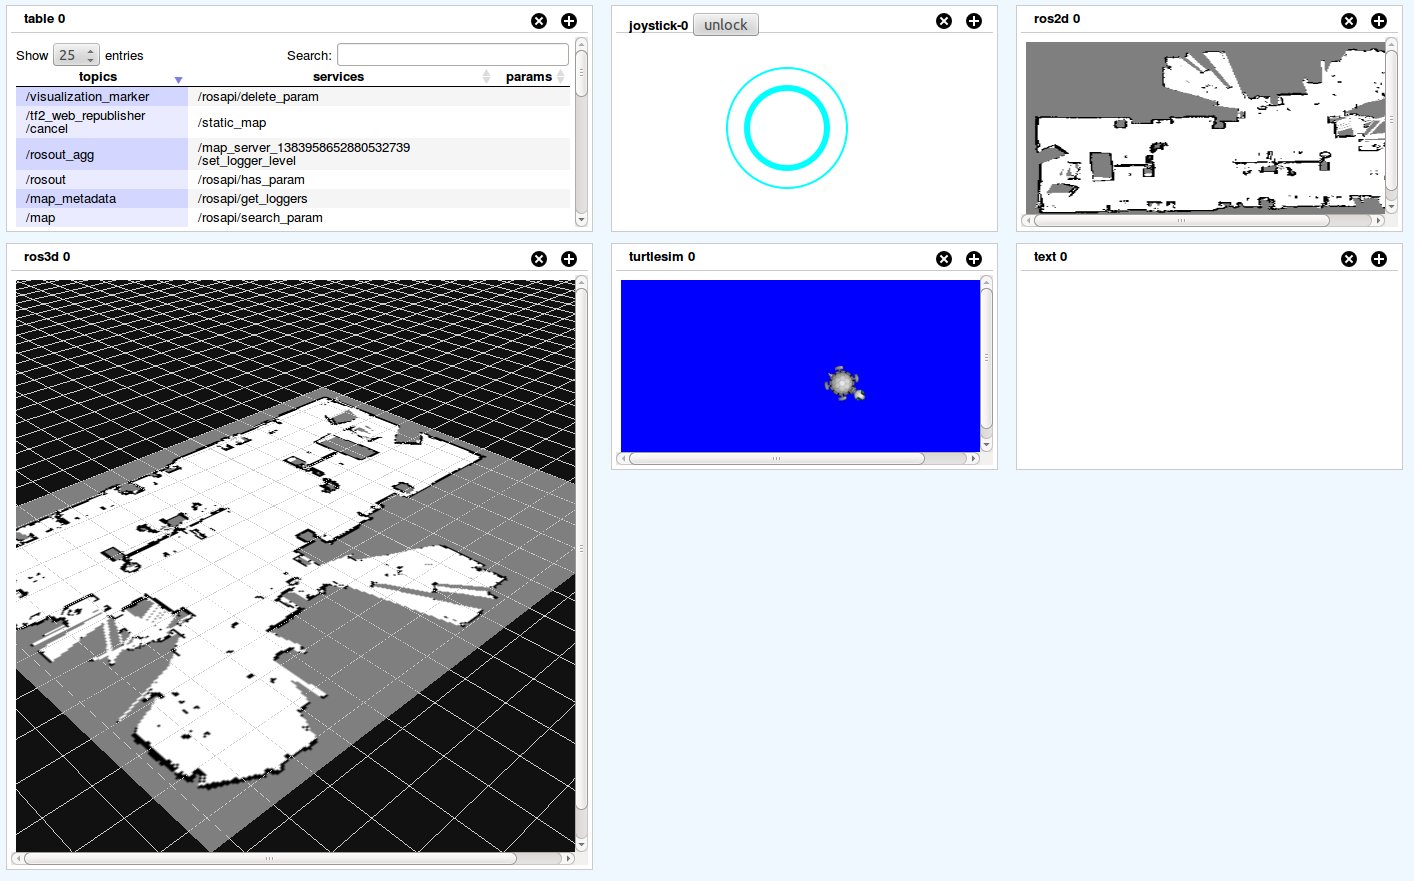
Usage
In ROSDASH, there are two pages for a dashboard: panel and diagram.
- Panel: it communicates with ROS and your robots, and visualize data from your robots.
- Diagram: blocks and connections between them representing the message relations between.
Steps to use the panel and connect with robots:
- Run roscore and rosbridge in the command line;
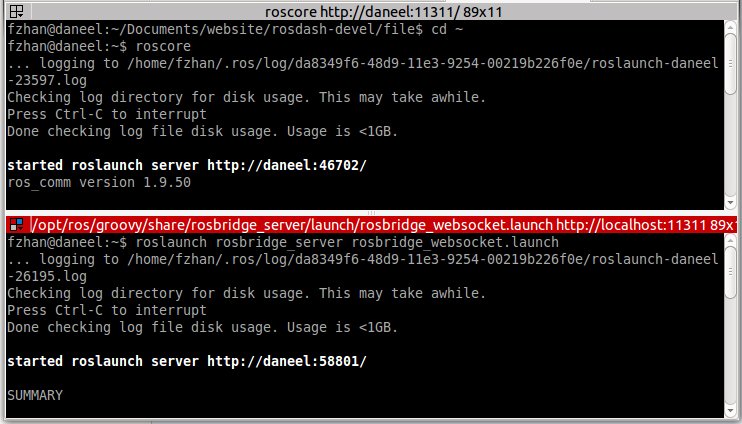
- Open the dashboard page in your browser, and specify the ip address of the rosbridge;
- Open the panel page;
- Enjoy it!
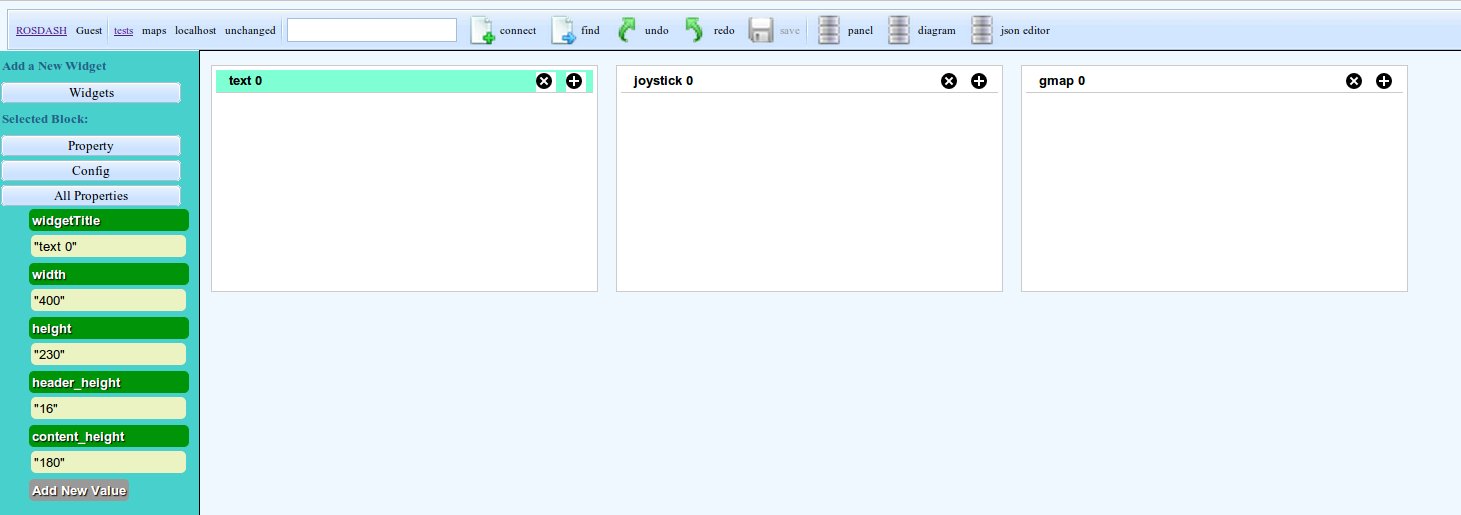
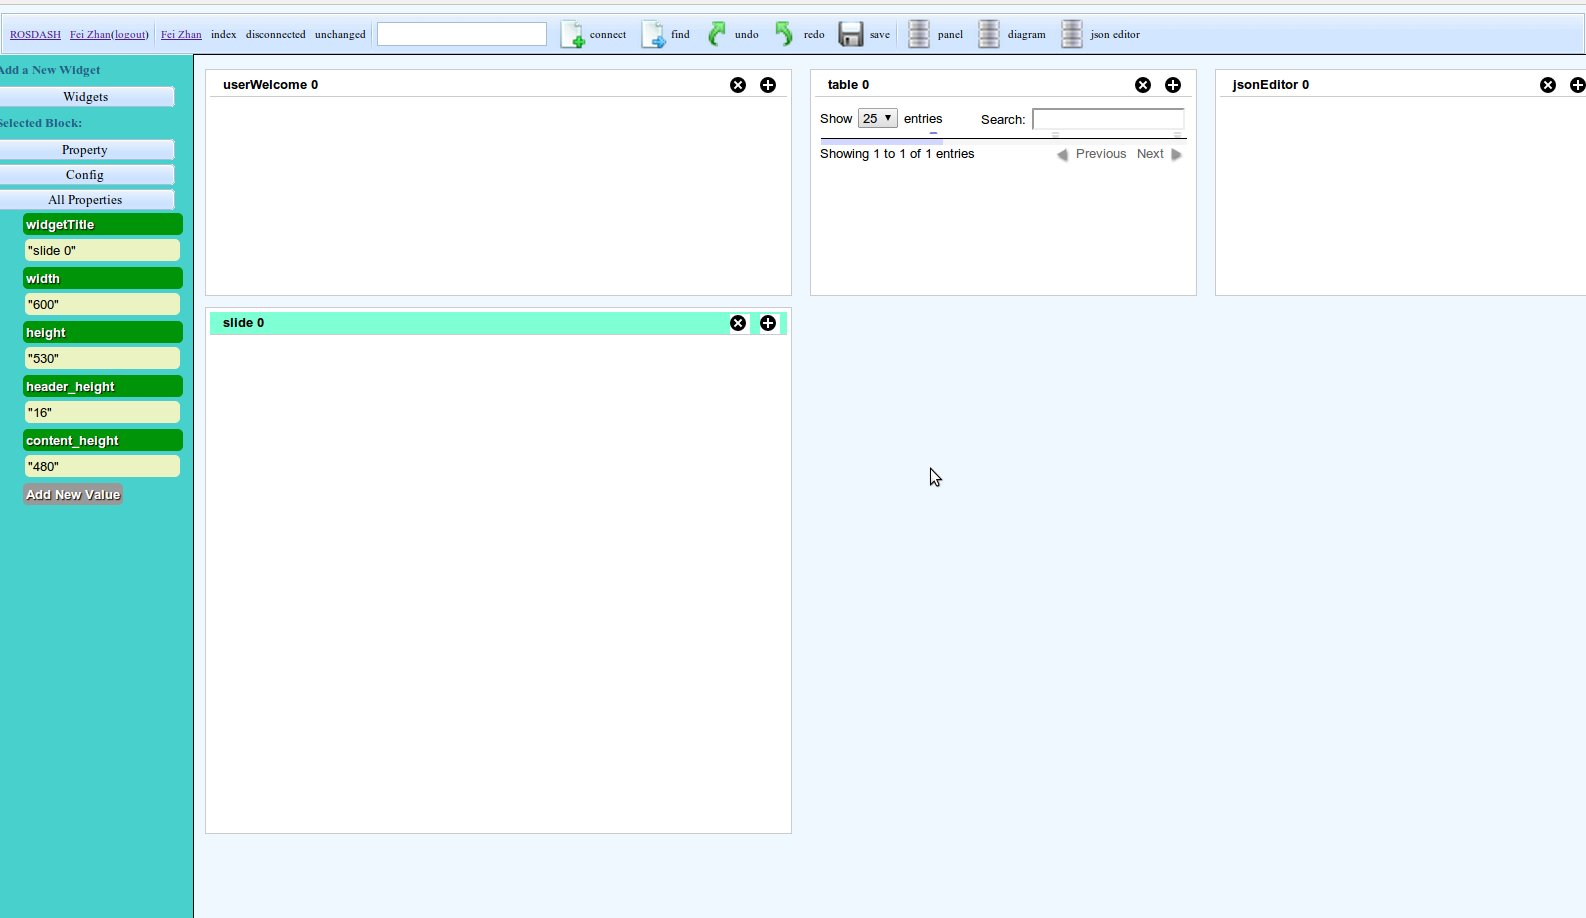
How to edit the panel page:
- Open the corresponding editor page;

- Click on Widget button on the sidebar, and choose a widget to add;
- Click on a widget, and modify the height and width on the sidebar;
- Press save button.
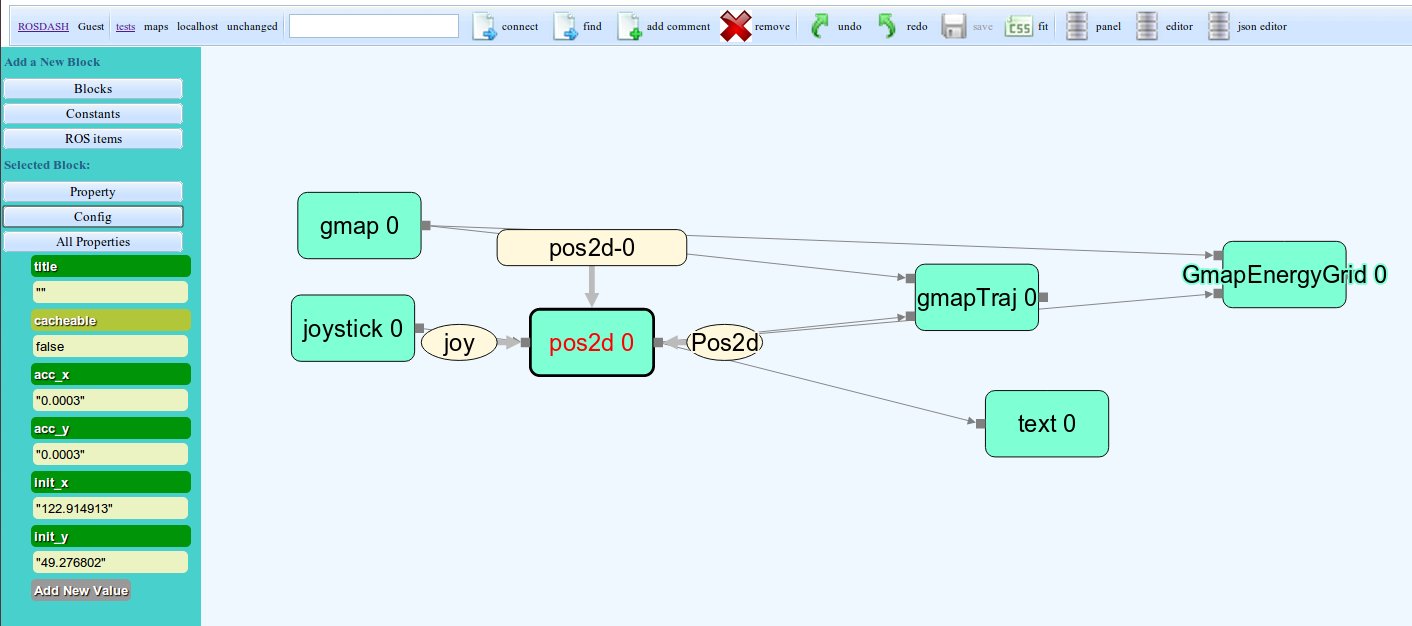
How to use the diagram page:
- Open the corresponding diagram page;
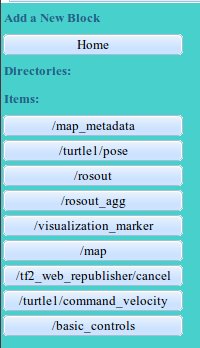
- Click on "ROS items" button on the sidebar, and choose a topic, service, or param to add. The topics, services, and params represent messages from your ROS system;
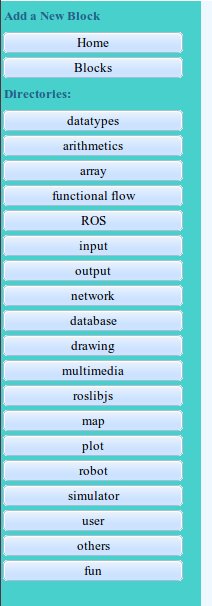
- Click on "blocks" button on the sidebar, and choose a block to add. Most of the blocks represent widgets on the panel page;
- Click on the pins on those blocks, and put a line between them, which represents send the message from ROS to widget;
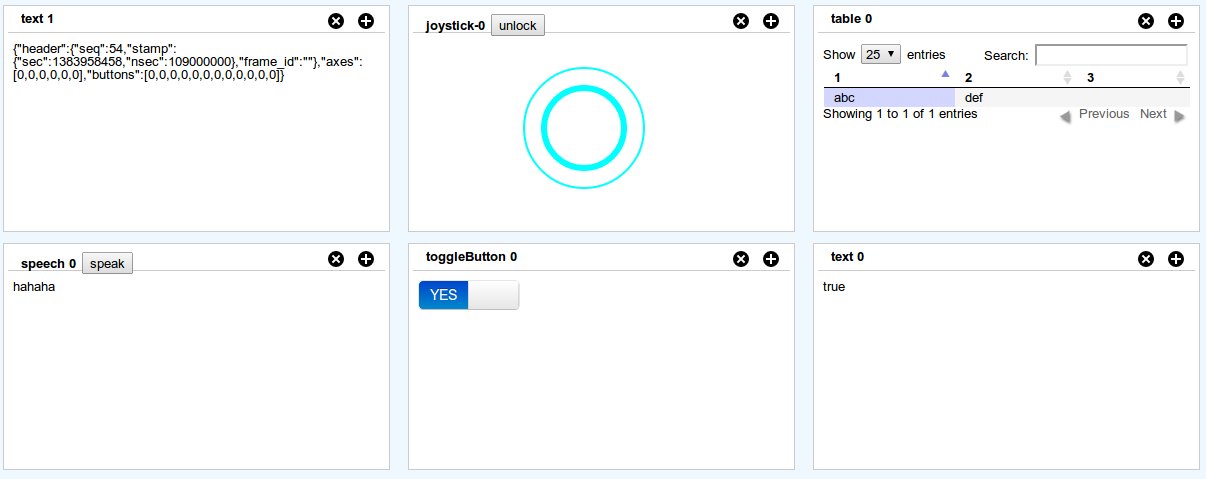
A list of all widgets available is as follows:
- toggleButton: ;
- joystick: ;
- text: ;
- speech: ;
- table: ;
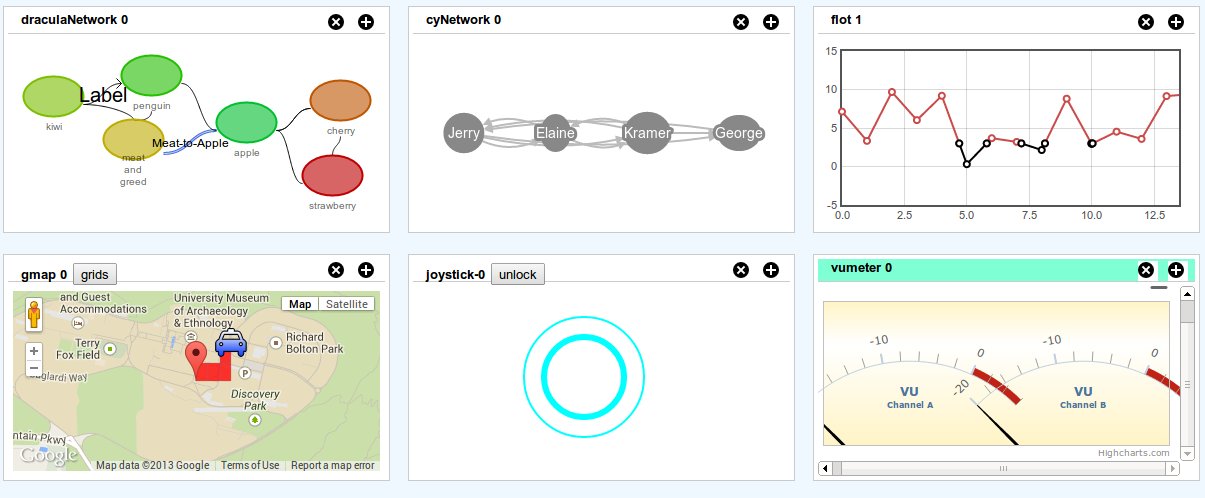
- chart: ;
- cyNetwork: ;
- arborNetwork: ;
- draculaNetwork: ;
- gmap: ;
- OpenLayersMap: ;
- flot: ;
- vumeter: ;
- UserCamera: ;
- HeadTracker: ;
- HandTracker: ;
- turtlesim: ;
- ros2d: ;
- ros3d: ;
- pr2urdf: ;
- jsonEditor: ;
- jsonVis: ;
- youtube: ;
- slide: ;
- FathomSlide: ;
A list of all blocks available is as follows:
-
datatypes: ;
- multiArray: ;
-
arithmetics: ;
- : ;
-
array: ;
- : ;
-
functional flow: ;
- : ;
-
ROS: ;
- : ;
-
input: ;
- : ;
-
output: ;
- : ;
-
network: ;
- : ;
-
database: ;
- : ;
-
drawing: ;
- : ;
-
multimedia: ;
- : ;
-
roslibjs: ;
- : ;
-
maps: ;
- : ;
-
plot: ;
- : ;
-
robot: ;
- : ;
-
simulator: ;
- : ;
-
user: ;
- : ;
-
others: ;
- : ;
Examples
Widget Development
The programming language for the widget development is Javascript. Usually, I design a widget as a class, and put callback functions inside.
The events for callback functions are as follows:
- addWidget: when a widget is added to HTML. We usually append the canvas tags (i.e. < div >, < canvas >, etc.) to the dashboard;
- init: when a widget is initialized. It is envoked after the webpage is created and before the widget is executed. You can do some initialization stuff here;
- runOnce: it is envoked in the first cycle of execution and for only once;
- run: it is envoked in the each cycle of execution;
- other events: i.e. when rosbridge is connected, when the webpage completes, etc.
The information and data for callback functions to use are as follows:
- ROSDASH.userConf: the information of the user (the person who is using the dashboard);
- ROSDASH.dashConf: the information of the dashboard in use;
- ROSDASH.ros: the instance of rosbridge connection;
- ROSDASH.rosConnected: if rosbridge is connected or not;
- ROSDASH.rosNames: names of ros topics, services, and params;
- ROSDASH.msgs: definitions of ros msgs;
- ROSDASH.blockDef: definitions of widgets;
- ROSDASH.blocks: information of blocks in the diagram;
- ROSDASH.requireLoadList: required files, i.e. js files, css files, etc;
- ROSDASH.updateWidgetContent: modify the content of a widget directly.
Dependencies
- dracula
- mjpegcanvasjs
- Highcharts
- JSONSelect
- jquery-ui-1.10.3
- taffydb
- keyboardteleopjs
- underscore
- jsDraw2DX
- bootstrap-switch
- ros3djs
- speak.js
- roslibjs
- js-handtracking-read-only
- d3
- predis
- dhtmlxSuite
- ros2djs
- turtlesimjs
- DataTables
- cytoscape.js-2.0.2
- FlexiJsonEditor
- jquery-2.0.3.min.js
- sDashboard
- fathom
- EaselJS
- flot
- arbor
- openlayers
- nav2djs
- EventEmitter
- headtrackr
- bootstrap
- js-aruco-read-only
- virtualjoystick.js
License
GNU GENERAL PUBLIC LICENSE Version 3, 29 June 2007
Authors
- Fei Zhan
Acknowledgement
Thanks to the support of Prof Richard Vaughan and Autonomy Lab.
The logo of ROSDASH is from the logo of Autonomy Lab.
Todo List
- Undo, redo;Priority 1
- Change widget input and output into better format;Priority 10
- msg type relations;Priority 2
- New block position (follow mouse?);Priority 6
- New pin position;Priority 4
- Add a new pin;Priority 4
- Connect blocks by popups;Priority 6
- Design a uniform representation for network diagram;Priority 3
- Design a uniform representation for plotting;Priority 3